
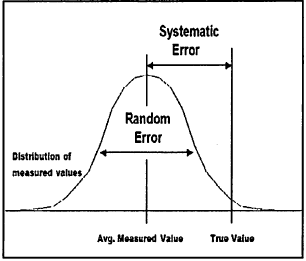
(This graphical representation is from Ted Vosk’s presentation at the AAFS meeting. I am unsure as to where he got it. This graphical representation again looks at an individual measure and shows the difference between Type I error and Type II error. Type I error can be termed, by and large, as a function of bias; whereas, Type II error is, by and large, a function of calibration.)

 The McShane Firm | DUI Lawyers
 Pennsylvania DUI Blog