Calibration (and bias) schema is a procedure that imperfectly transforms a response into a useful measure.
Some crime laboratories have no method or manner as to how, why or when they should calibrate their instruments. Other laboratories have truly arbitrary intervals that they calibrate their instruments, but then they declare that this arbitrary interval is sufficient to insure against lack of precision or accuracy or analytical drift without data to support such a declaration.

First, who really cares what some crime laboratory thinks they should be doing? If we let them run themselves we get tragedies like San Francisco or Colorado or Nassau or Houston. While it is useful to discover their own published internal “this is the way we do it” ideas and they may prove to be useful to throw it in their face if they don’t follow their own established procedure, their method of “we do it every month or every week” is not true science!
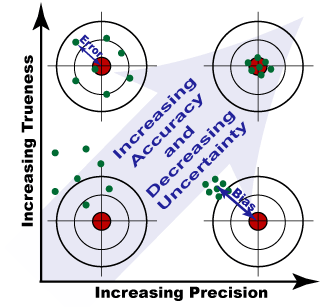
Remember, calibration and bias have to do with precision and accuracy respectively. The issue surrounds analytical drift and other basics of metrology. Over time regardless of use (however, heavy throughput does exacerbate the problem and so too does also lack of use) all analytical devices lose their sensitivity, their precision and their accuracy.

- This graphical representation is the best one to show the intersect of these dependent features over multiple measures. As we can see from this depiction the goal of minimizing risk of bias and calibration error is a moving target. You adjust one and the other may suffer. It is also quite costly to minimize both simultaneously. It is exponentially easier and cheaper to correct for calibration error than bias error.
For more on the nomenclature involved please visit “A rose by any other name??? More on Metrology and its nomenclature”
To have a valid result that is close as scientifically possible to achieving a true result, those seeking to measure must prove and demonstrate that they are robust and stable in their approach to measurement. At a minimum, this is:
- why they must establish external calibration curves in a metrologically responsible way using CRMs in at least a 5×5 method with concentrations involving analytes of interest and internal standards within the range of predicted response (demonstrated linear dynamic range), and
- why they must insert controls and verifiers (at the least a high and a low concentrations involving analytes of interest and internal standards within the range of predicted response) within a run, and
- why control charts must be maintained.
While having a “we do it every Monday” plan is swell, it does not necessarily equate to demonstrating that they have a robust method and stable instruments which may result in good analysis that is valid and as close to achieving a true result as scientifically possible. They must have and use control charts and other data to justify that this established interval of calibration and accuracy schema. Calibration and its interval must be a data driven decision and not an act of faith or guesswork.
We would do well to remember that simply because there has been demonstrated linearity within a certain dynamic range [they use Ordinary Least Squares (coefficient of variation or basic regression analysis)=0.999, when they should be using Weighted Least Squares], in reality it does not necessarily equate to a pronouncement that the measure itself is sound (meaning, I suppose, valid and true). All that it means, if properly established by a validated calibration and bias testing schema such as I describe below in points 1.1 through 1.7, is that the measure is within some sort of predicative interval within some level of statistical tolerance under those given conditions and variables that give rise to the calibration and bias attempt in the exact matrix that the CRMs are.
The basic seven steps to a robust and valid calibration schema using CRMs include:
1.1 Plot response versus true concentration using the 5-by-5 method,
1.2 Determine the behavior of the standard deviation of the response,
1.3 Fit the proposed model and evaluate R2adj,
1.4 Examine the residuals for non-randomness,
1.5 Evaluate the p-value for the slope (and any higher-order terms),
1.6 Perform a lack-of-fit evaluation, and
1.7 Plot and evaluate the prediction interval.
In industry (meaning Guideline for Good Clinical Practice, US Food and Drug Enforcement Administration-Good Laboratory Practices methods, Good Manufacturing Practices methods, US Environmental Protection Agency methods, and International Conference on Harmonization publications) (note that there are no universal standards in terms of instructions for calibration and bias schemas in forensic science) a method needs to be re-validated (e.g., at a minimum a new calibration curve established):
- Whenever there is a change in the method,
- Whenever there is change in instrumentation,
- Whenever there is a change in the software,
- Whenever there is change in the environmental conditions of the laboratory,
- Whenever there is change in the consumables (e.g, new septa, new injector port liner, new o-ring, column is removed and installed, column is clipped, column is adjusted, new make-up gas cylinder is installed, new carrier gas cylinder is installed, new golden seal is installed, new FID is installed, etc.)
- Whenever there is a recorded apparent aberrant result,
- Whenever the machine appears to be outside of validated control chart pre-established calibration and bias areas, and
- Whenever the analyst has reason to believe or suspect that there has been analytical drift or loss of calibration and increase in bias.
Some folks have established in their GLP that when executing a full shut down and re-powering up of the instrument there is a significant enough change to require full calibration and bias determination to occur again. Others say that that is not a significant enough event, but they have data to support that decision.
In forensic science, where is the data?


